Monitoring is essential to understand what is happening on your IT system. There are well know monitoring tools. Some of them are PRTG, Nagios, SolarWinds ( I will mention on it another post). Grafana and Zabbix are open source and more flexible. I used SolarWinds trial edition with combination of SNMP and NetFlow configuration as well. However, I will mention on Grafana.
Step 1. Install CentOS or Ubuntu
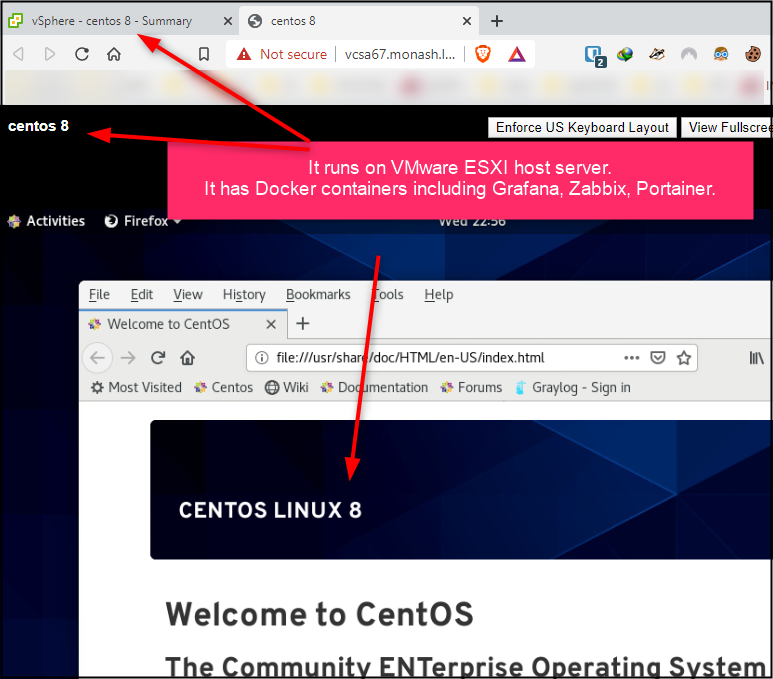
At first, I need a host server to run docker containers which are more flexible and practical. You can use CentOS or Ubuntu as a host server. Once you use docker containers, you do not need to any other virtual machine. Docker container is an cutting edge virtualization technology. I think that Linux virtualization, namely, LXC/LXD was substituted by it. In addition, it takes a proportion from other virtualization technologies such as VMware, Hyper-V and cloud systems. Lets started.
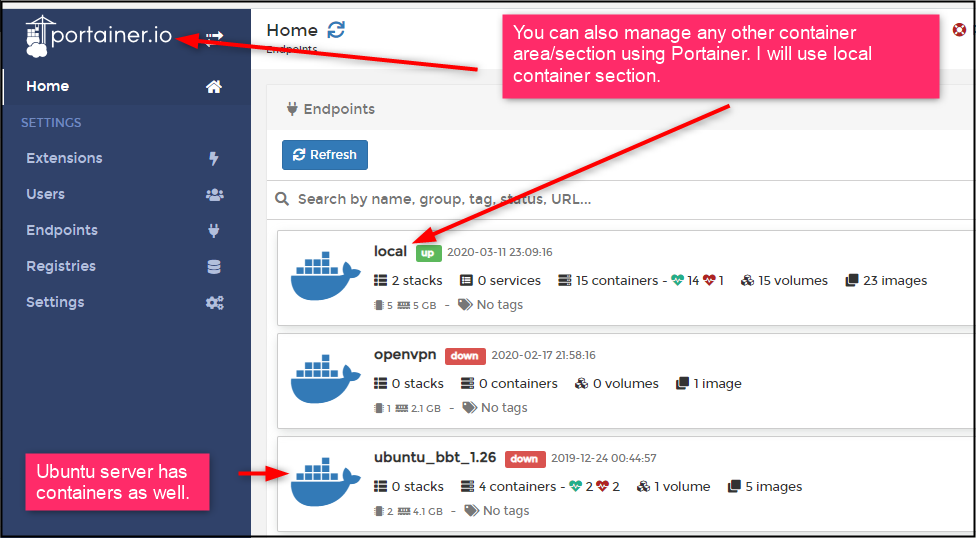
If you look at the link, above, you may come across docker. We can learn docker, however, how to manage them easily. A solution is to use Portainer. Docker education can be an another post. In IT ecosystem, it is not enough to be good at something. It means that one IT field or system is interrelated to others. If you want to monitor your network or whatever you want, you should engage with virtualization(VMWare, Hyper-V, Docker), Linux, network and sysadmin knowledge.
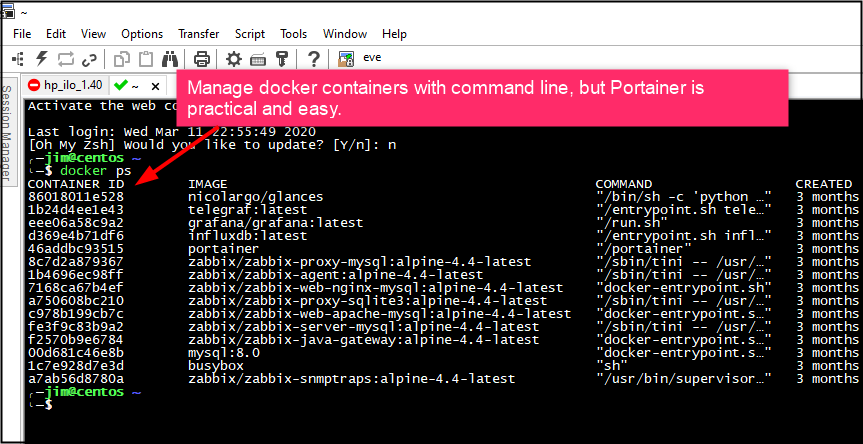
Of course, you can manage your docker containers using command line, as shown below.
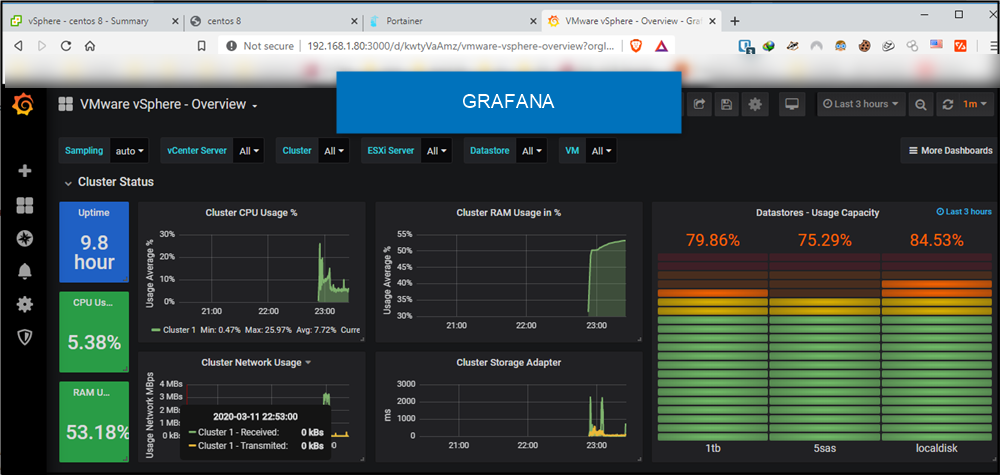
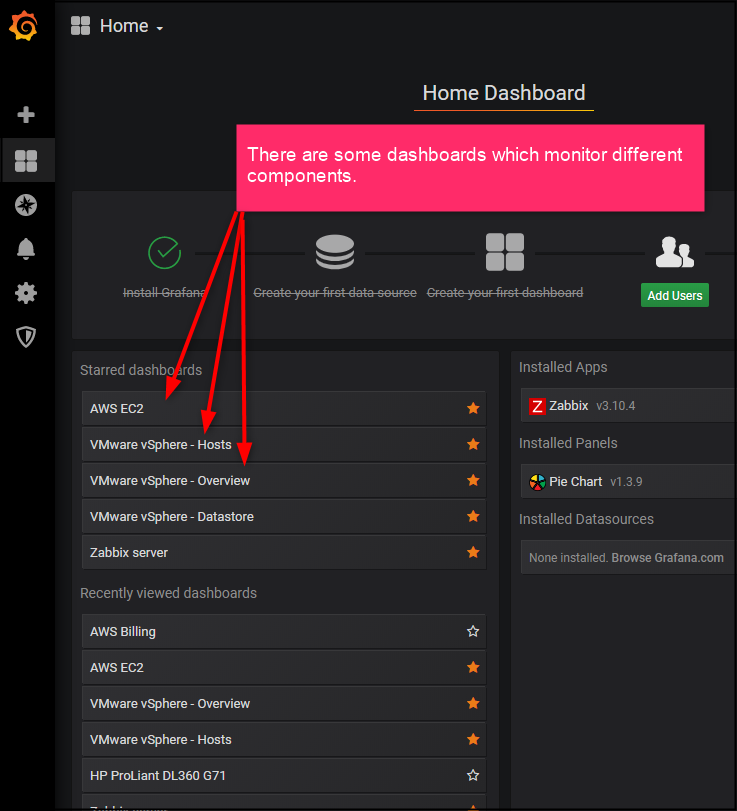
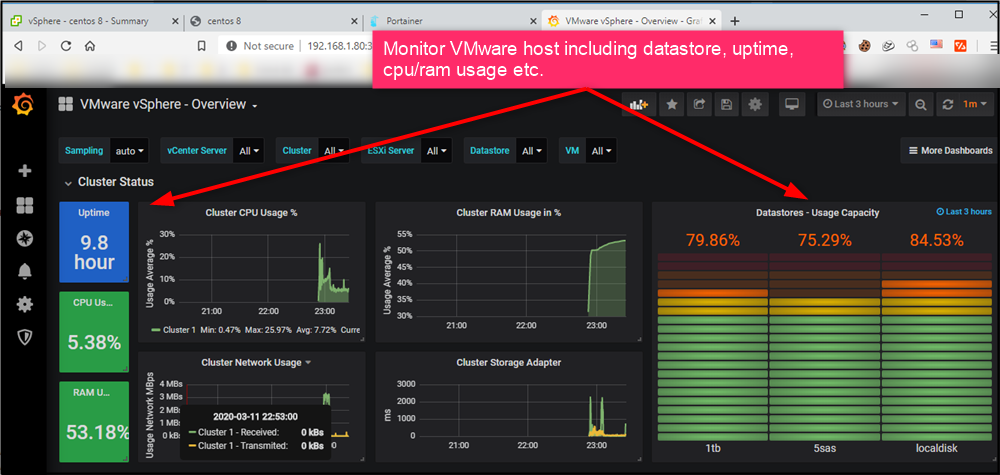
Lets look at the Grafana which monitors some part of my home network. There are some good examples on the internet. You can add your network devices on it.
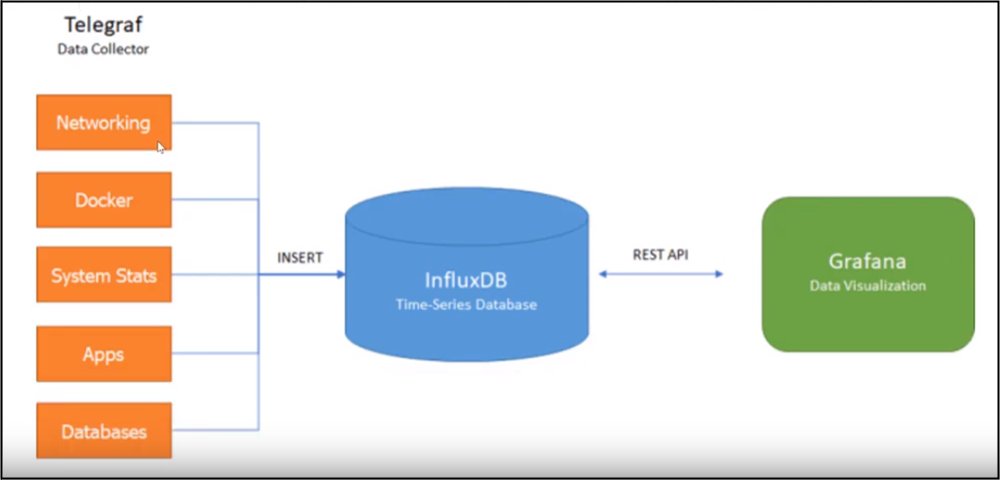
Step 3. Grafana - Retrieve, keep data and monitor IT system.
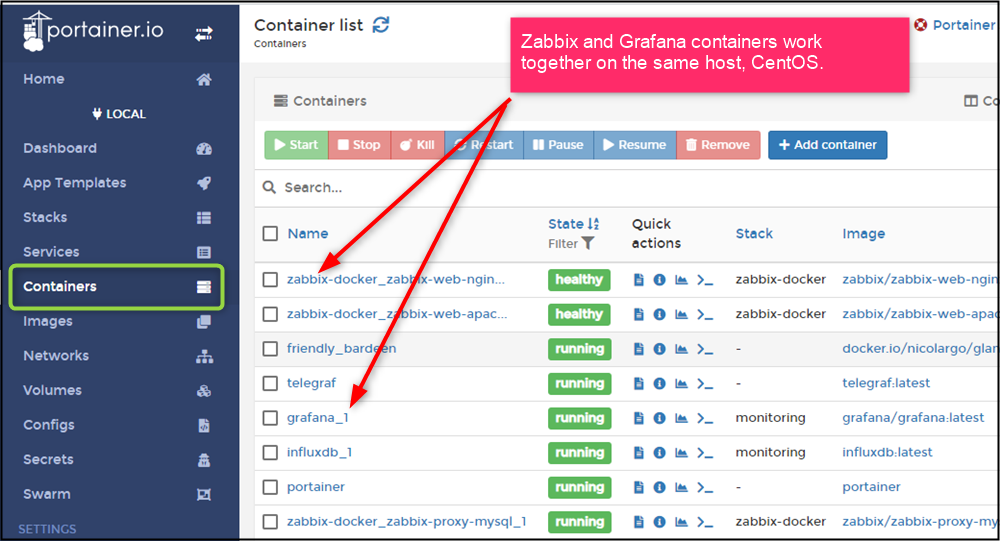
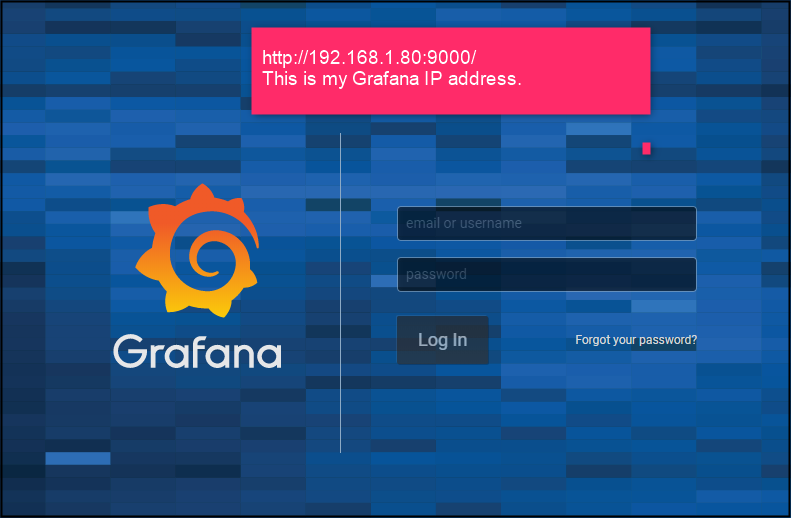
The concept of it; retrieve and collect data >> put into InfluxDB >> use them for visualization on Grafana, as shown above.You deployed your CentOS, docker containers and you need to access your Grafana dashboard. Access to Grafana IP address which is assigned to the docker. Keep in that mind,containers use different ports while they use host IP. It means that while Grafana uses default 9000 port number, http://192.168.1.80:9000/ , Zabbix or any other docker container can use 8433, 3000 port numbers such as http://192.168.1.80:8433/ . As I mentioned, it is an another post. You can see some pictures about it, shown below. Follow this video channel.
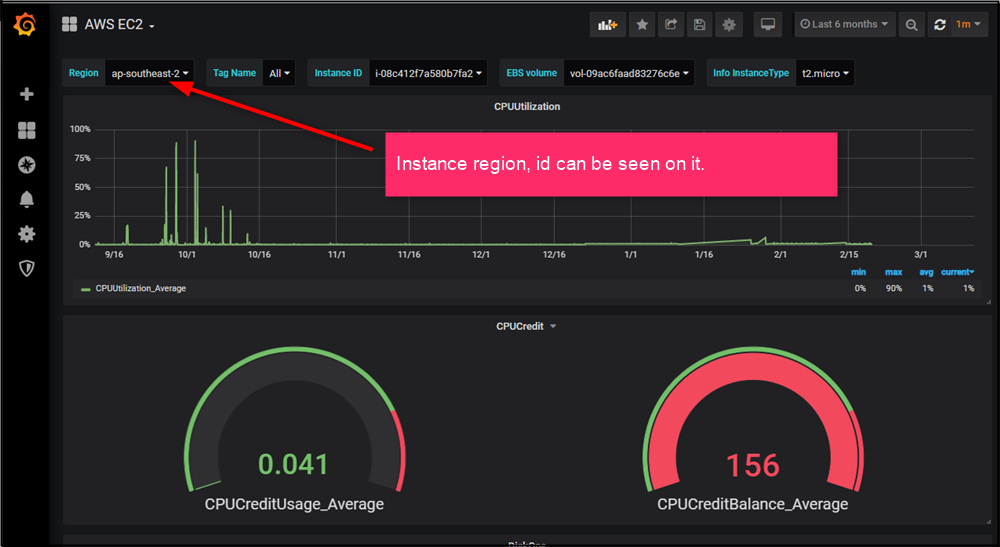
Step 5. Monitoring AWS instance on Grafana
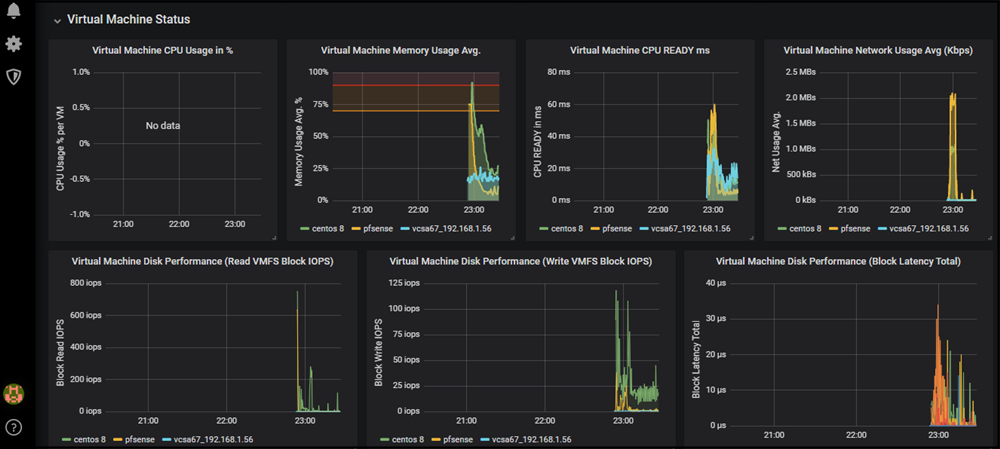
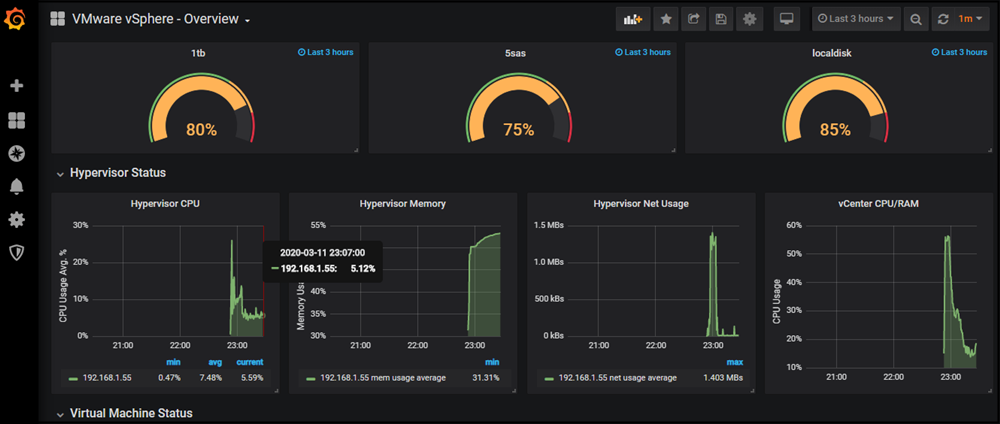
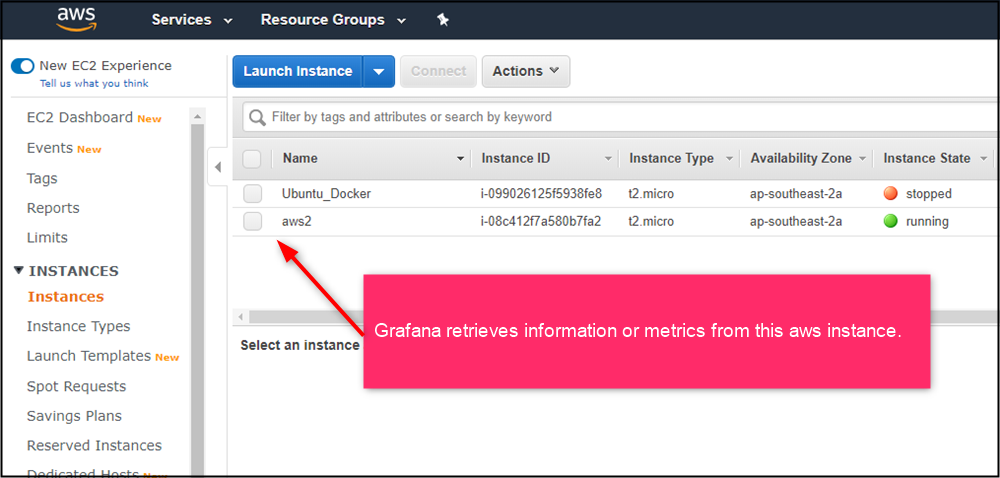
I think it looks nice. It covers all metrics such as CPU, ram, disk performance, storage, network usage etc. But hold on, what if you have an AWS instance. How can I monitor it without using AWS cloud watch. Follow this YouTube video, below. Visit https://grafana.com/and play with a demo version to get an idea.
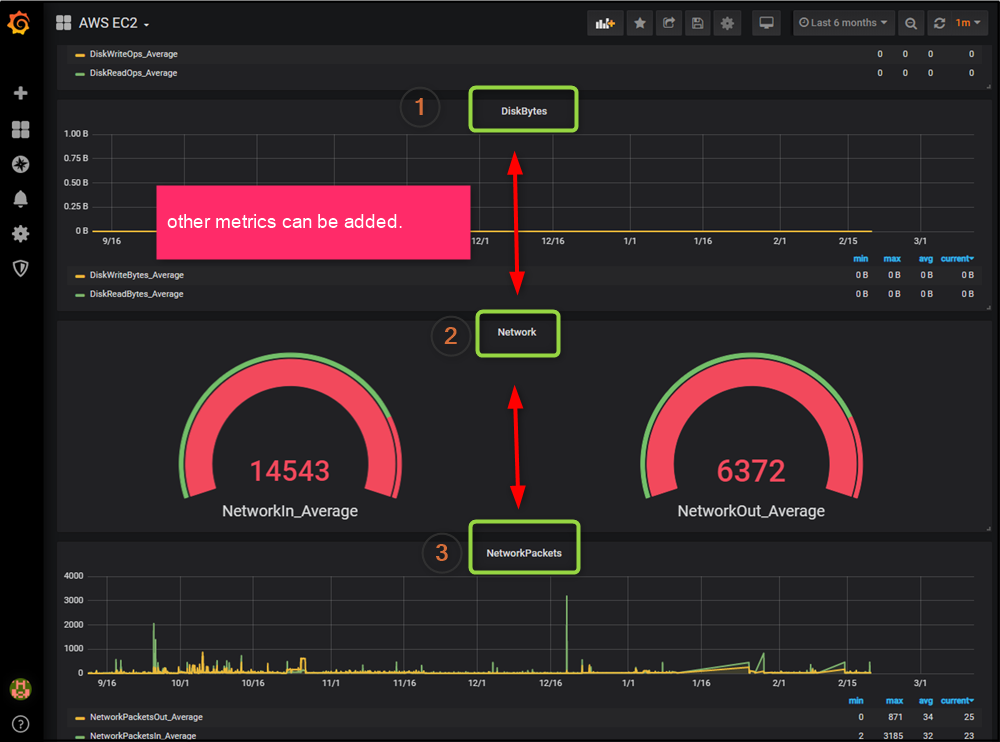
Have you noticed that? Grafana can monitor wide range of IT devices such as router, firewall, VMWare ESXI host, desktop, server, AWS cloud server etc. This is my aws instance.
Don’t worry, this is a predefined template which is available on Grafana website, shown below. There are goods templates on it.
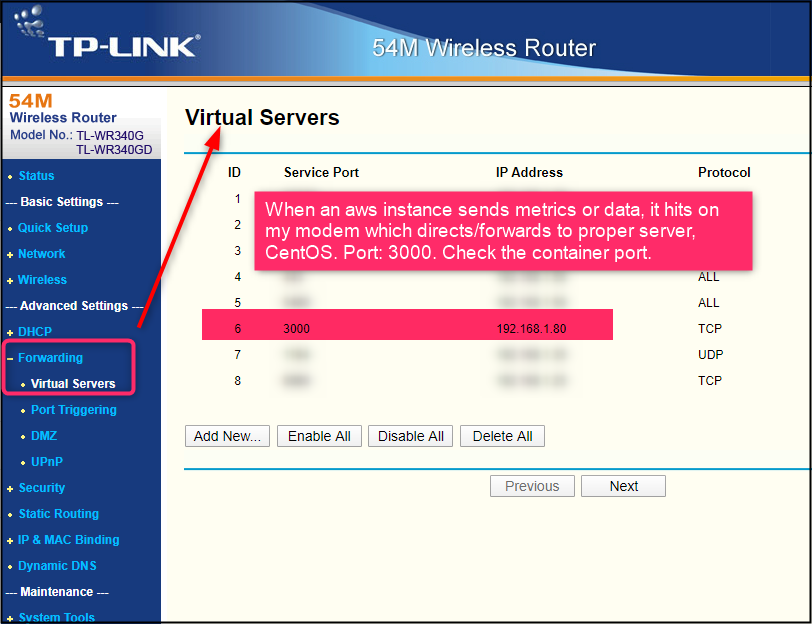
Step 6. Port Forwarding
Everything is fine. I can monitor LAN devices, however how does it work for some devices out of my LAN? How the packets come from AWS instance to my home network and access to the suitable server? As I mentioned before, this lab is an combination of Docker, Linux, AWS, Virtualization and networking. A good thing is that once you learn them generally, you can use them in every lab and projects.
The solution is to use Port Forwarding. You will use port forwarding for Honeypot, remote access to your server, OpenVpn later. Does it make sense? We need to implement some adjustment on the modem to send data for the proper server. I have an obsolete modem, however it works. I want to replace it with a small business firewall later. I can also use PfSense firewall which is an opensource.
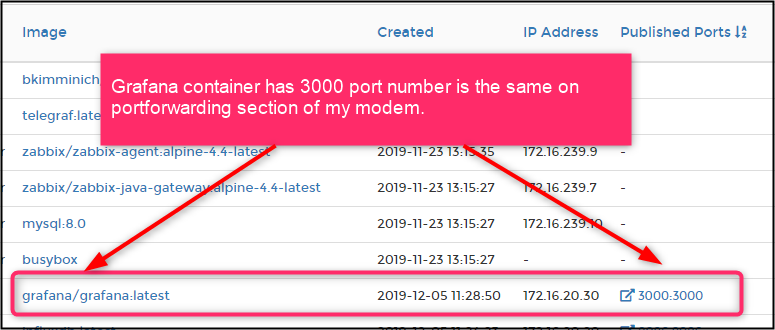
Go back to Portainer and check Grafana container’s port number, 3000, shown below, which was assigned on my modem.
You may be confused reading some part of it, however, once you deploy centos, docker, grafana, aws, you will use them frequently and be getting more confident. Keep learning.
In conclusion, there are more examples about usage of Grafana. I suggest anyone to look at other example on IT geek’s websites. It is an opensource. If you have a small or midsize IT system, you can use it.